
Adding Security Stack Analysis to the IT-Harvest Dashboard
Biggest upgrade to-date

Yesterday’s post, Mapping 11,326 products to NIST CSF 2.0, hinted at the next logical step in the evolution of the IT-Harvest Dashboard. Today, the press release went out. We have introduced the ability to add the products in a security stack to a list and then map your entire security stack to different frameworks including:
NIST CSF 2.0
MITRE ATT&CK
CIS
The IT-Harvest Layered Defense Model (new)
Creating a security stack analysis is the most frequent request we get from security teams and consultants. We have had the ability to provide this type of analysis for over a year but it still took a lot of work to create a report. Now, the only work involved is choosing your product stack from the 11,326 products in the database. All the mapping is taken care of.
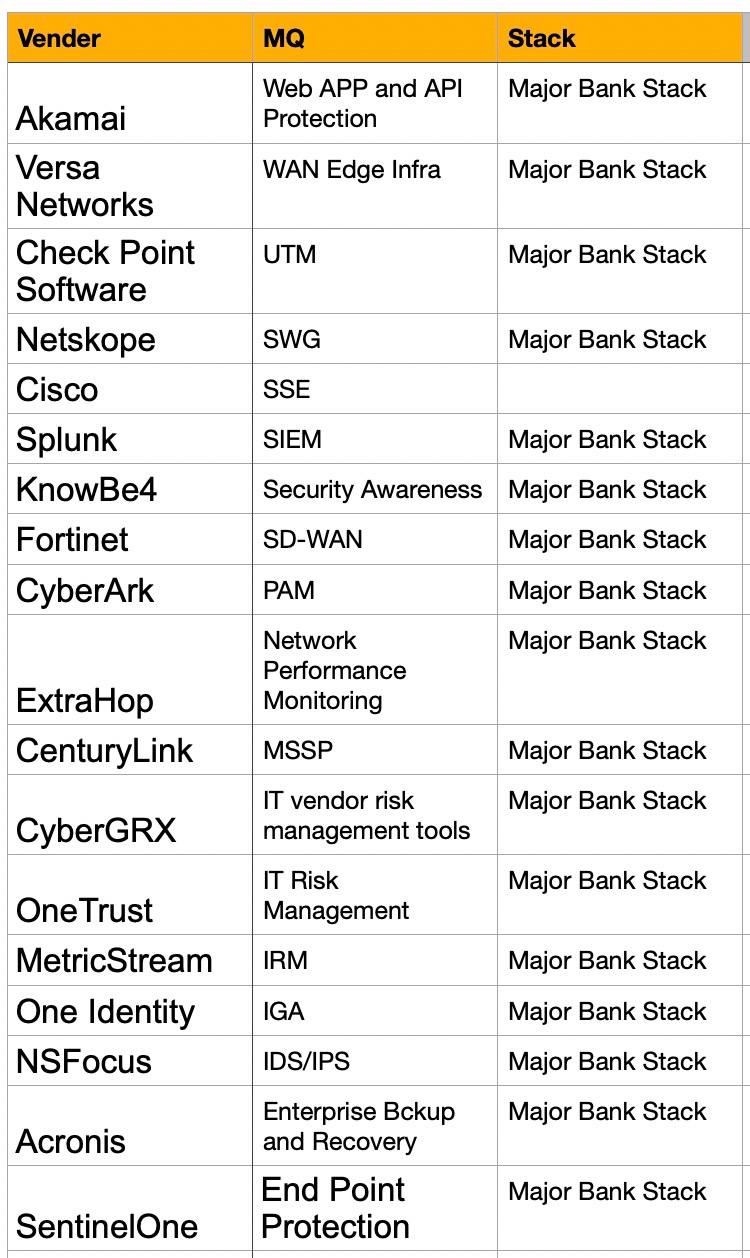
For an example I created a representative security stack from scratch. I started with my spreadsheet of all 267 products that appear in Gartner Magic Quadrants that we created so I could write 10,000 Cybersecurity Products. You can see the chart of vendors per MQ in that post. Here is the resulting stack:
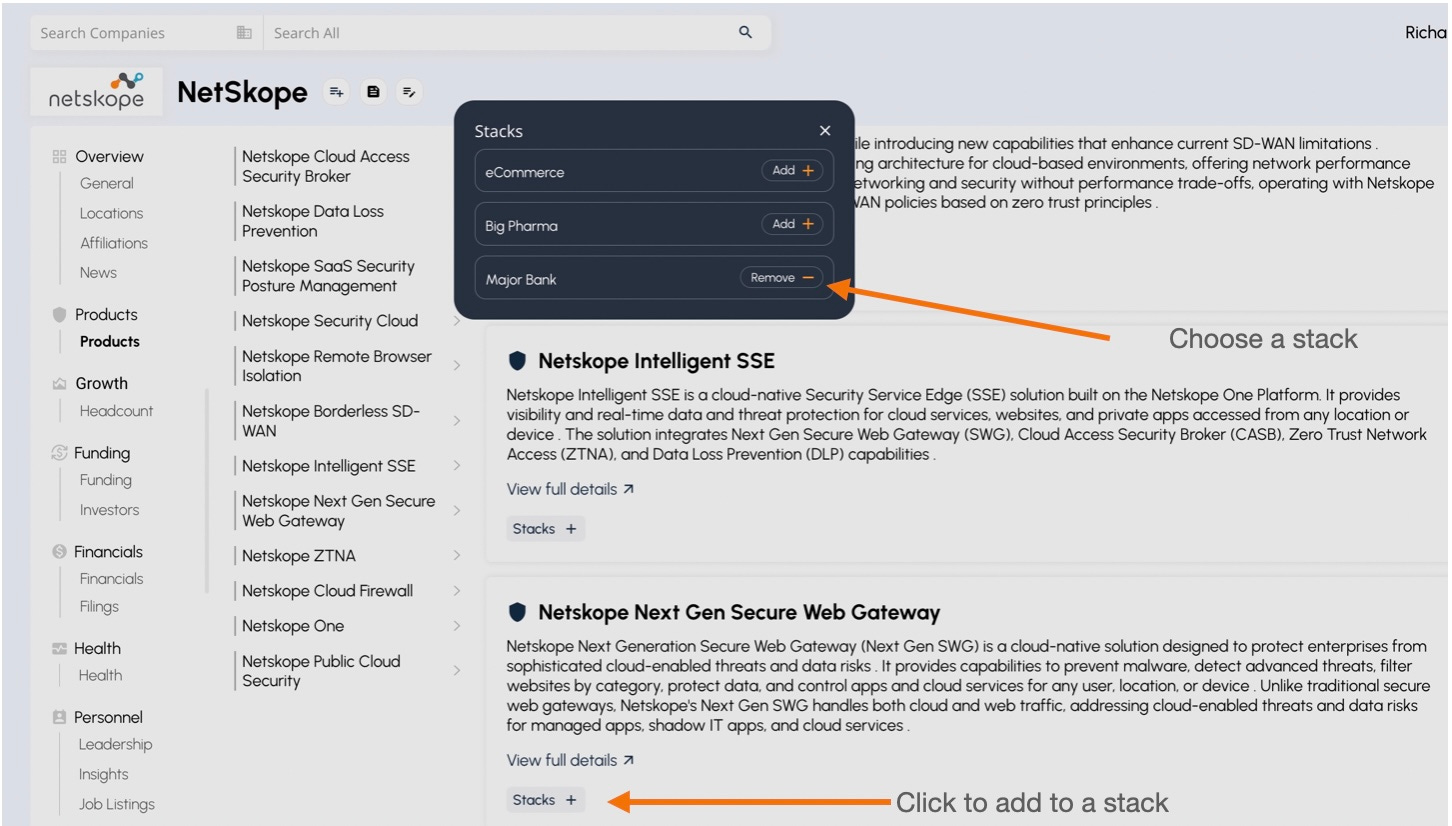
Then I simply navigate to each vendor’s product page in the Dashboard and add the products to a “Stack” that I had previously named.
It took 30 minutes to do this the first time for 17 products. A typical stack has at least 60 products in it so it could take two hours to accomplish this. But you could break the task up between team members to shorten that time. Ask a consulting firm to do that and they will quote a multi-month project.
For each stack you get a top level view like this:
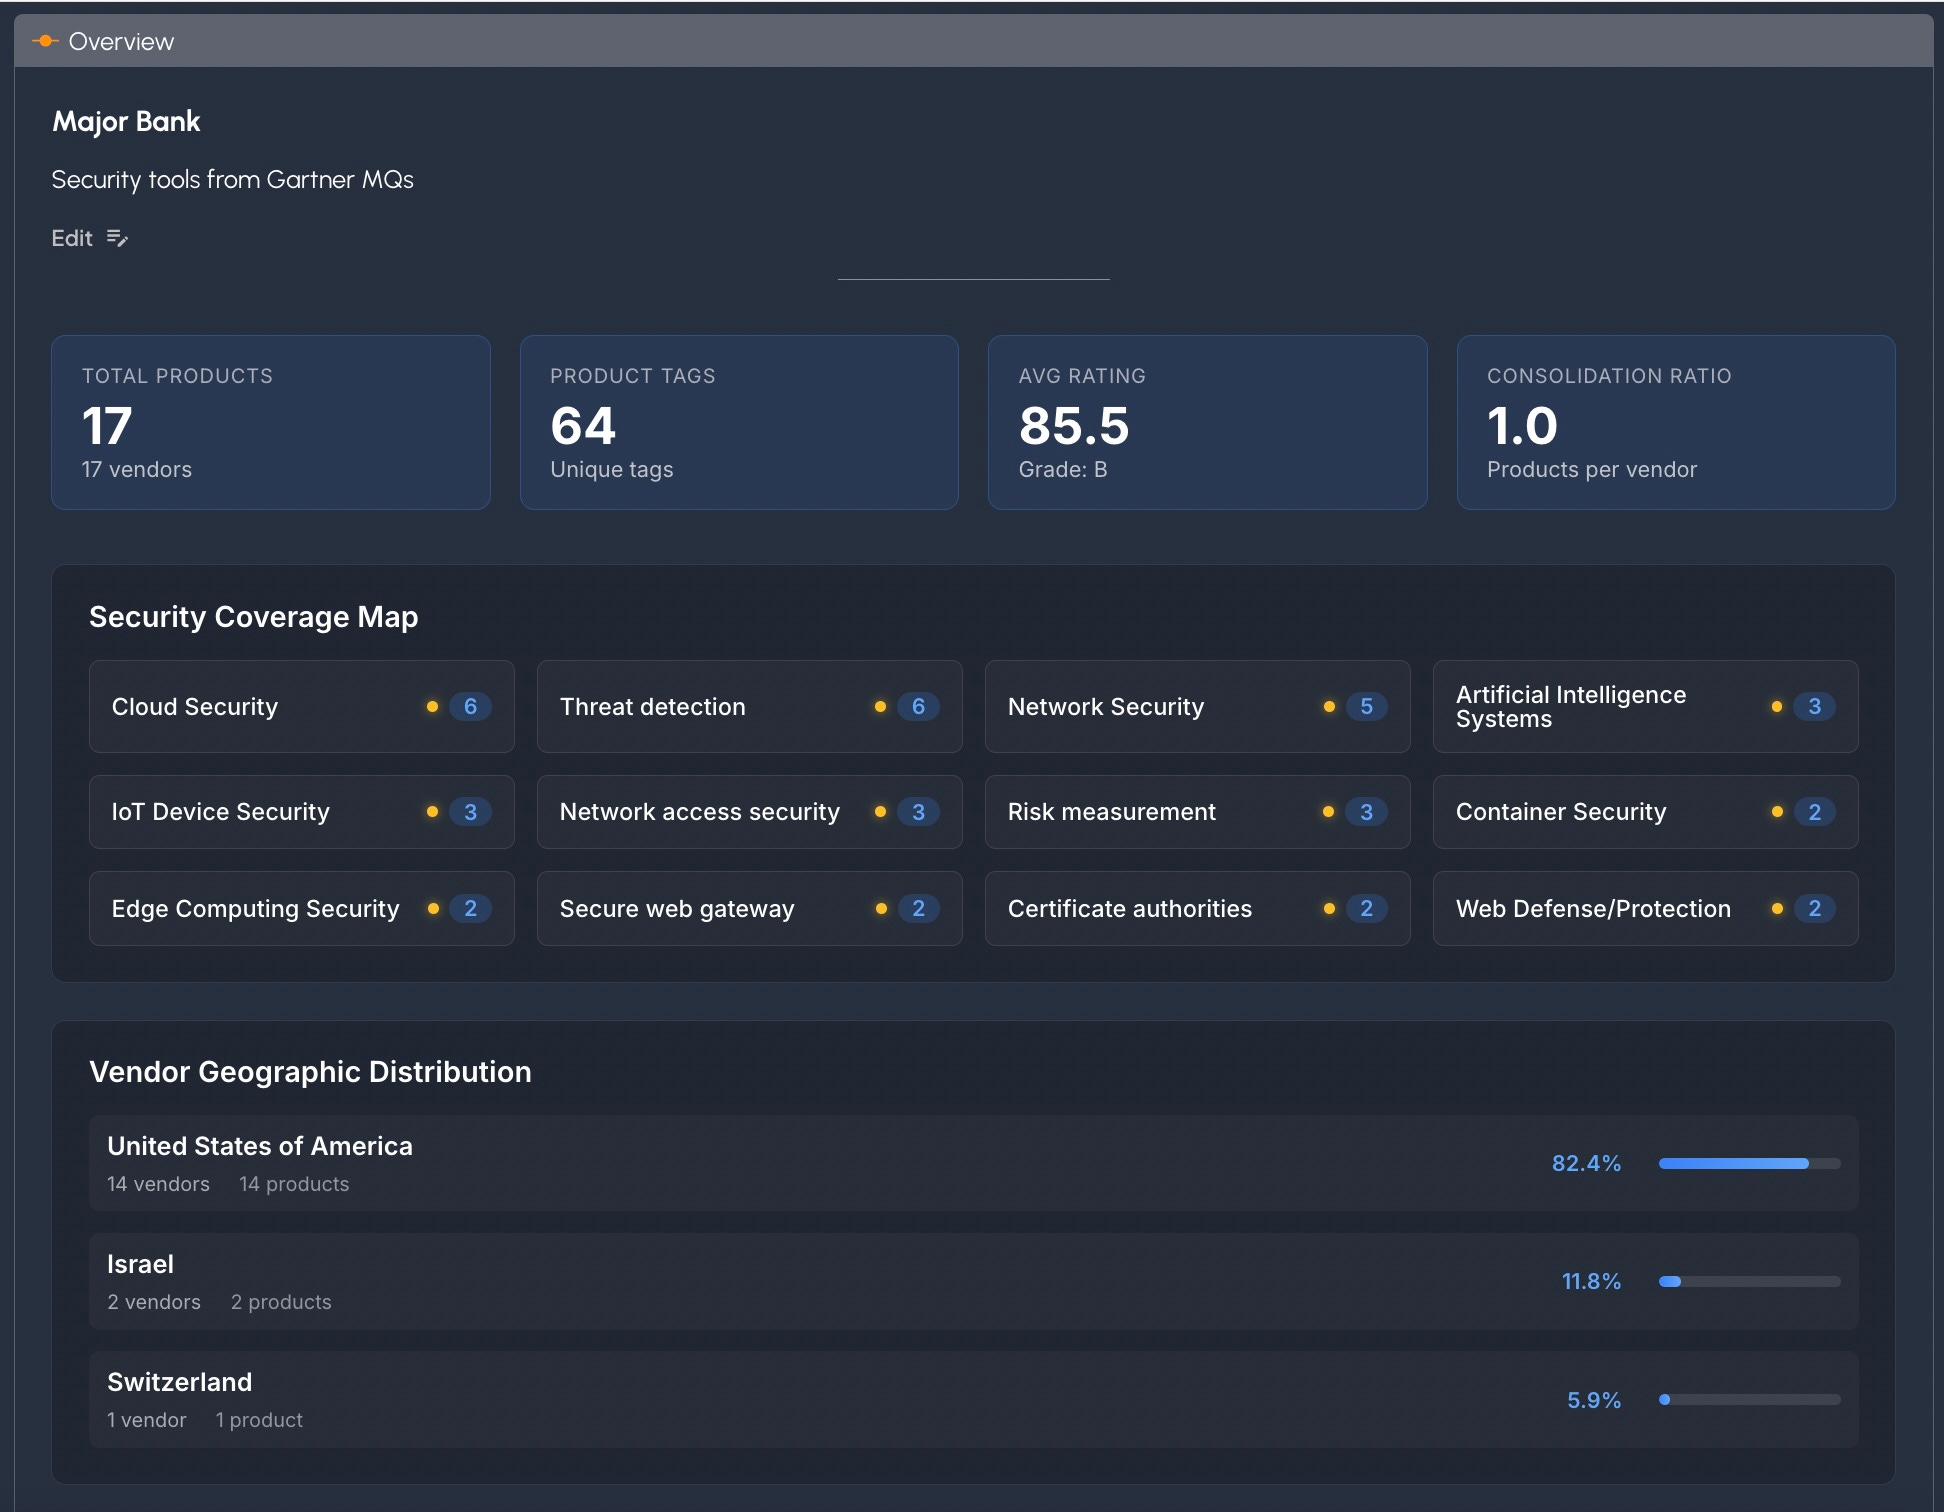
Note the Security Coverage Map, a view we had to create because most people want to see coverage by product category too. Also note the Vendor Geographic Distribution.
Scroll down to see the Vendor Risk Summary:
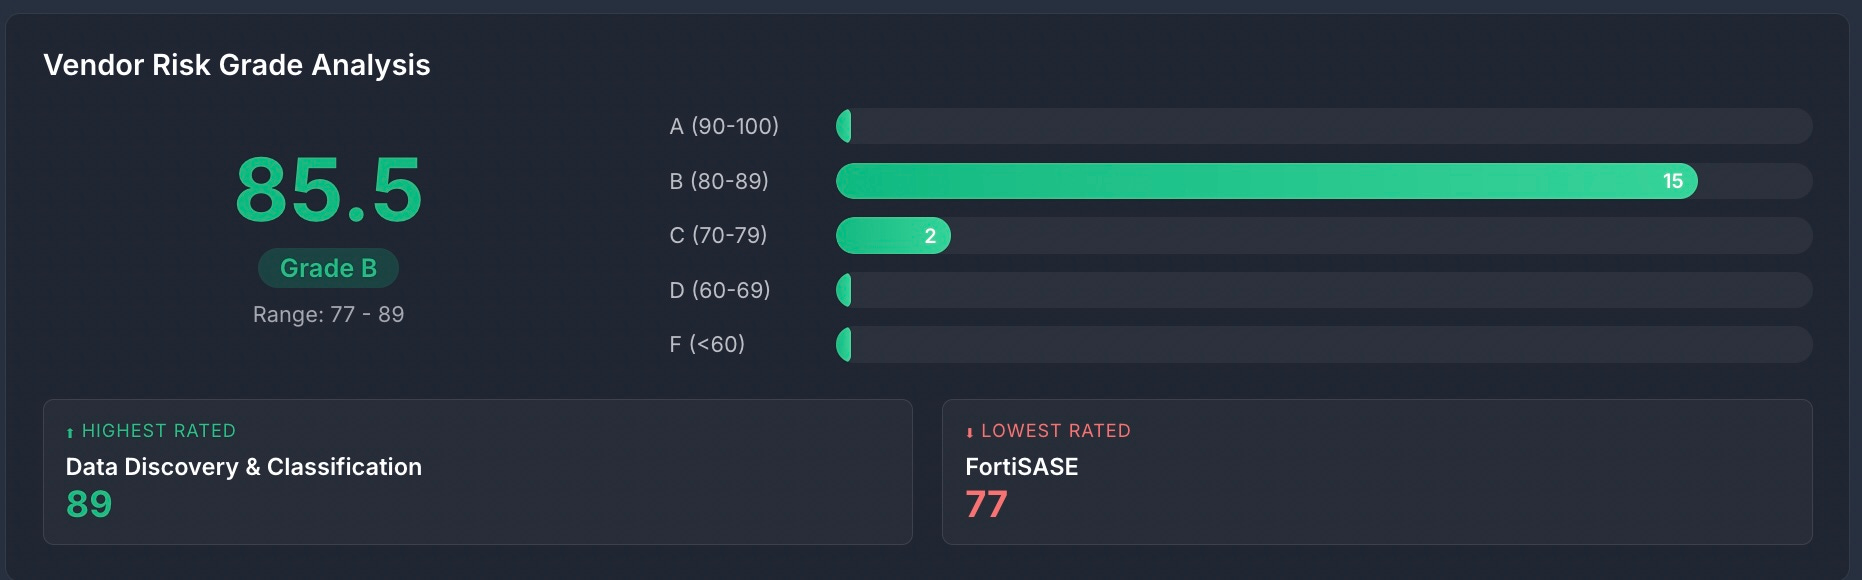
These are derived from the individual scores for each vendor provided by Black Kite.
Now let’s look at the NIST mapping.
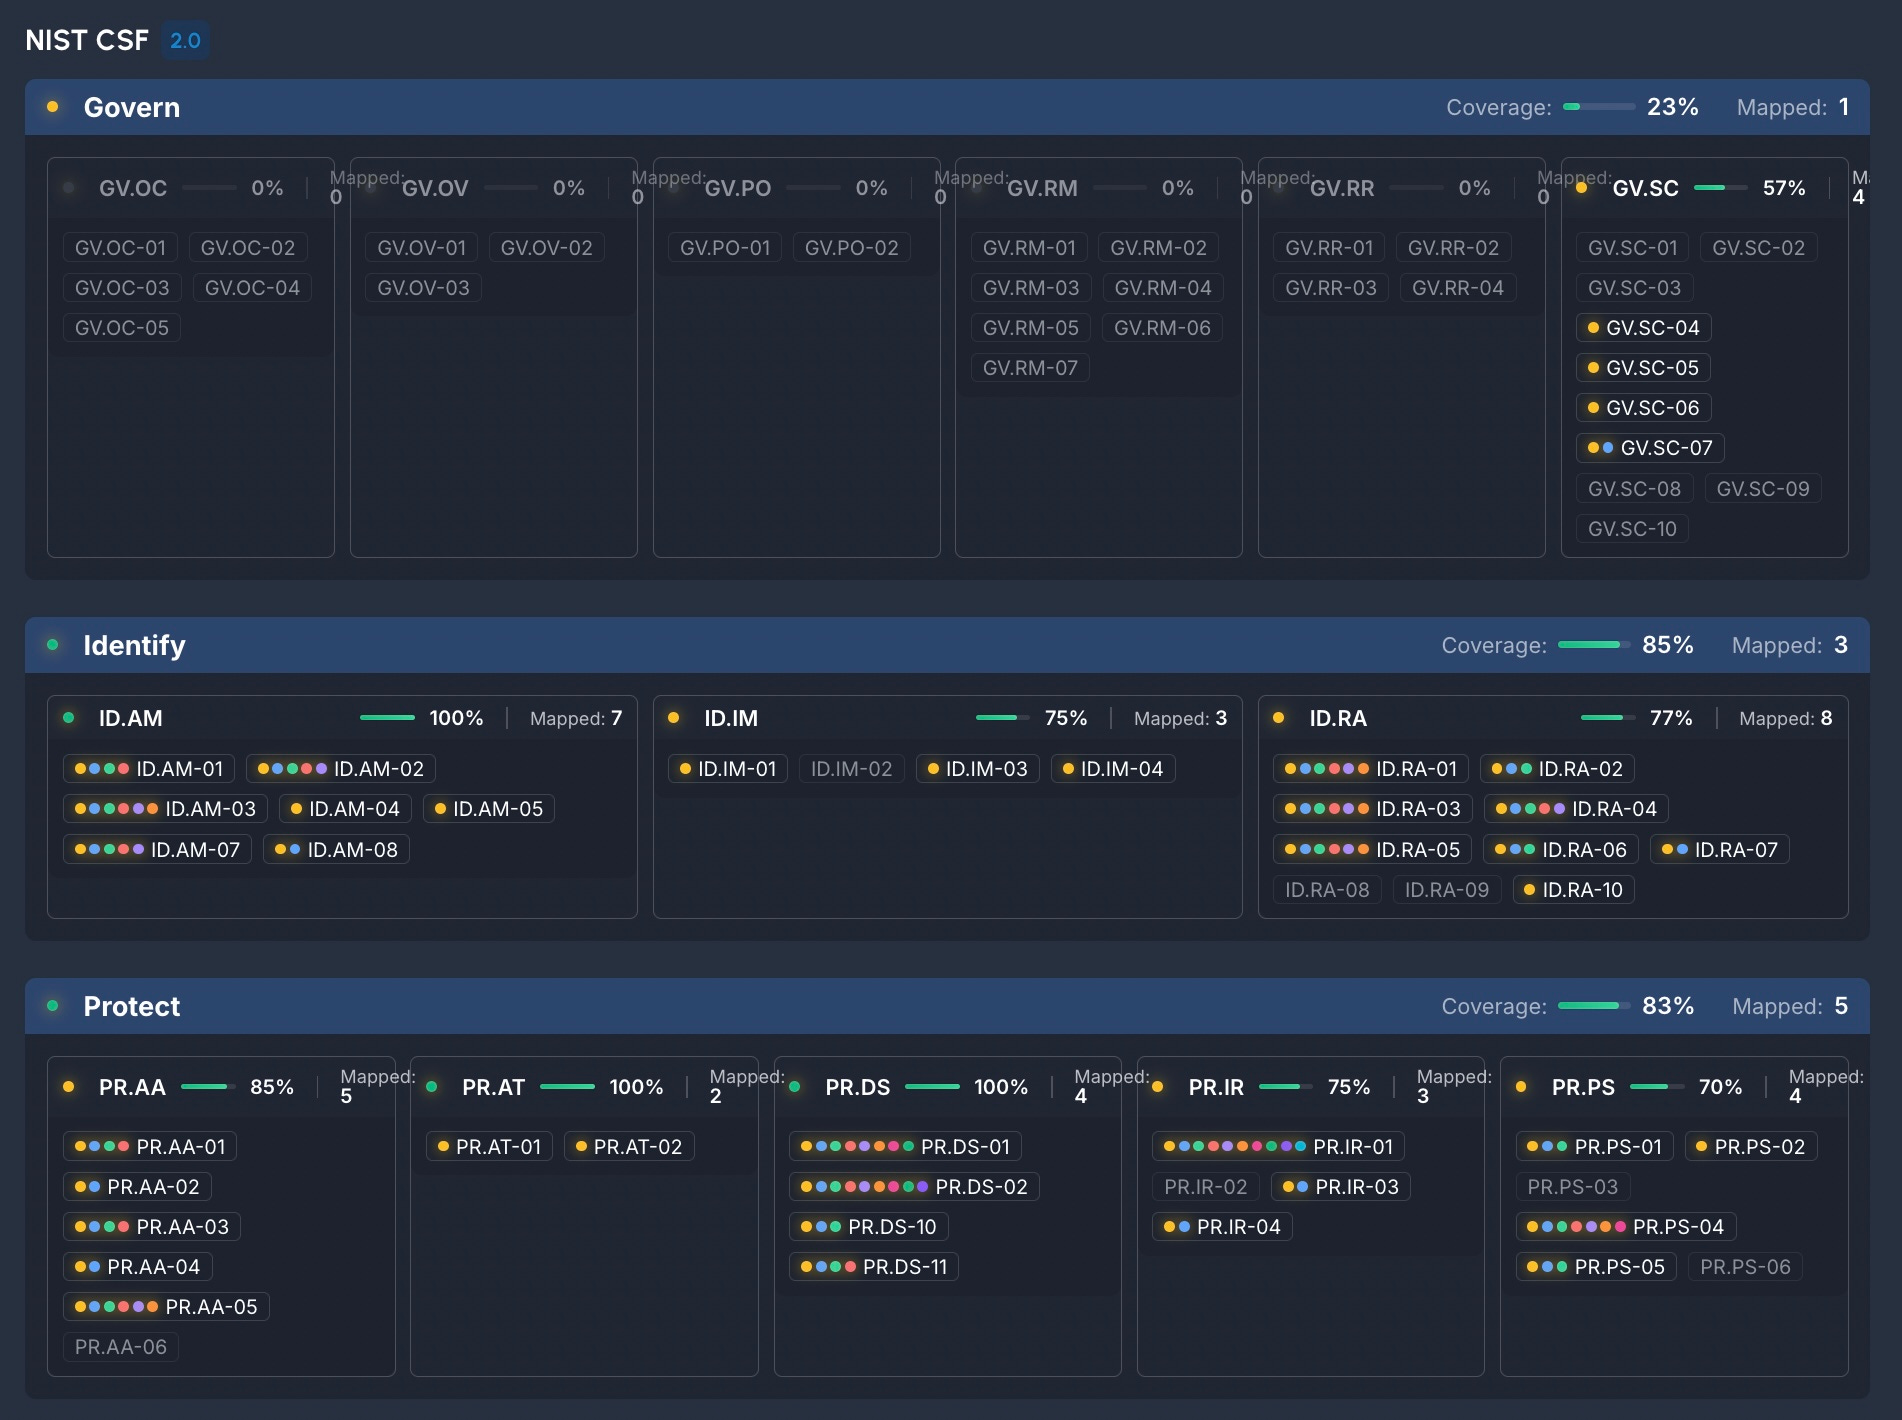
You can quickly get a general picture for overall coverage.
Govern has 23% coverage, Identify 85%, and Protect 83%.
Hover over a specific Subcategory to drill in:
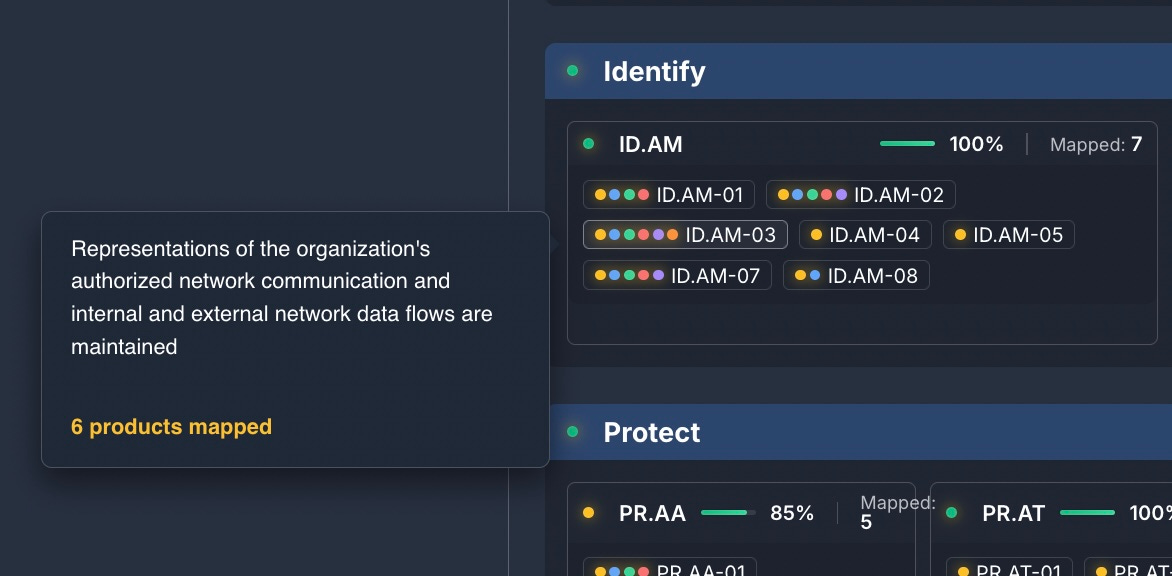
In all, each of the ID.AM Subcategories are covered leading to 100% for the asset management requirement. There are six products that apply to asset management data flow (ID.AM-03). A security team may want to look deeper at the implementations of those products. Is there a way to consolidate any of those products?
Exploring the Subcategories that have no mappings reveals a lack of physical security controls from the Security Stack.
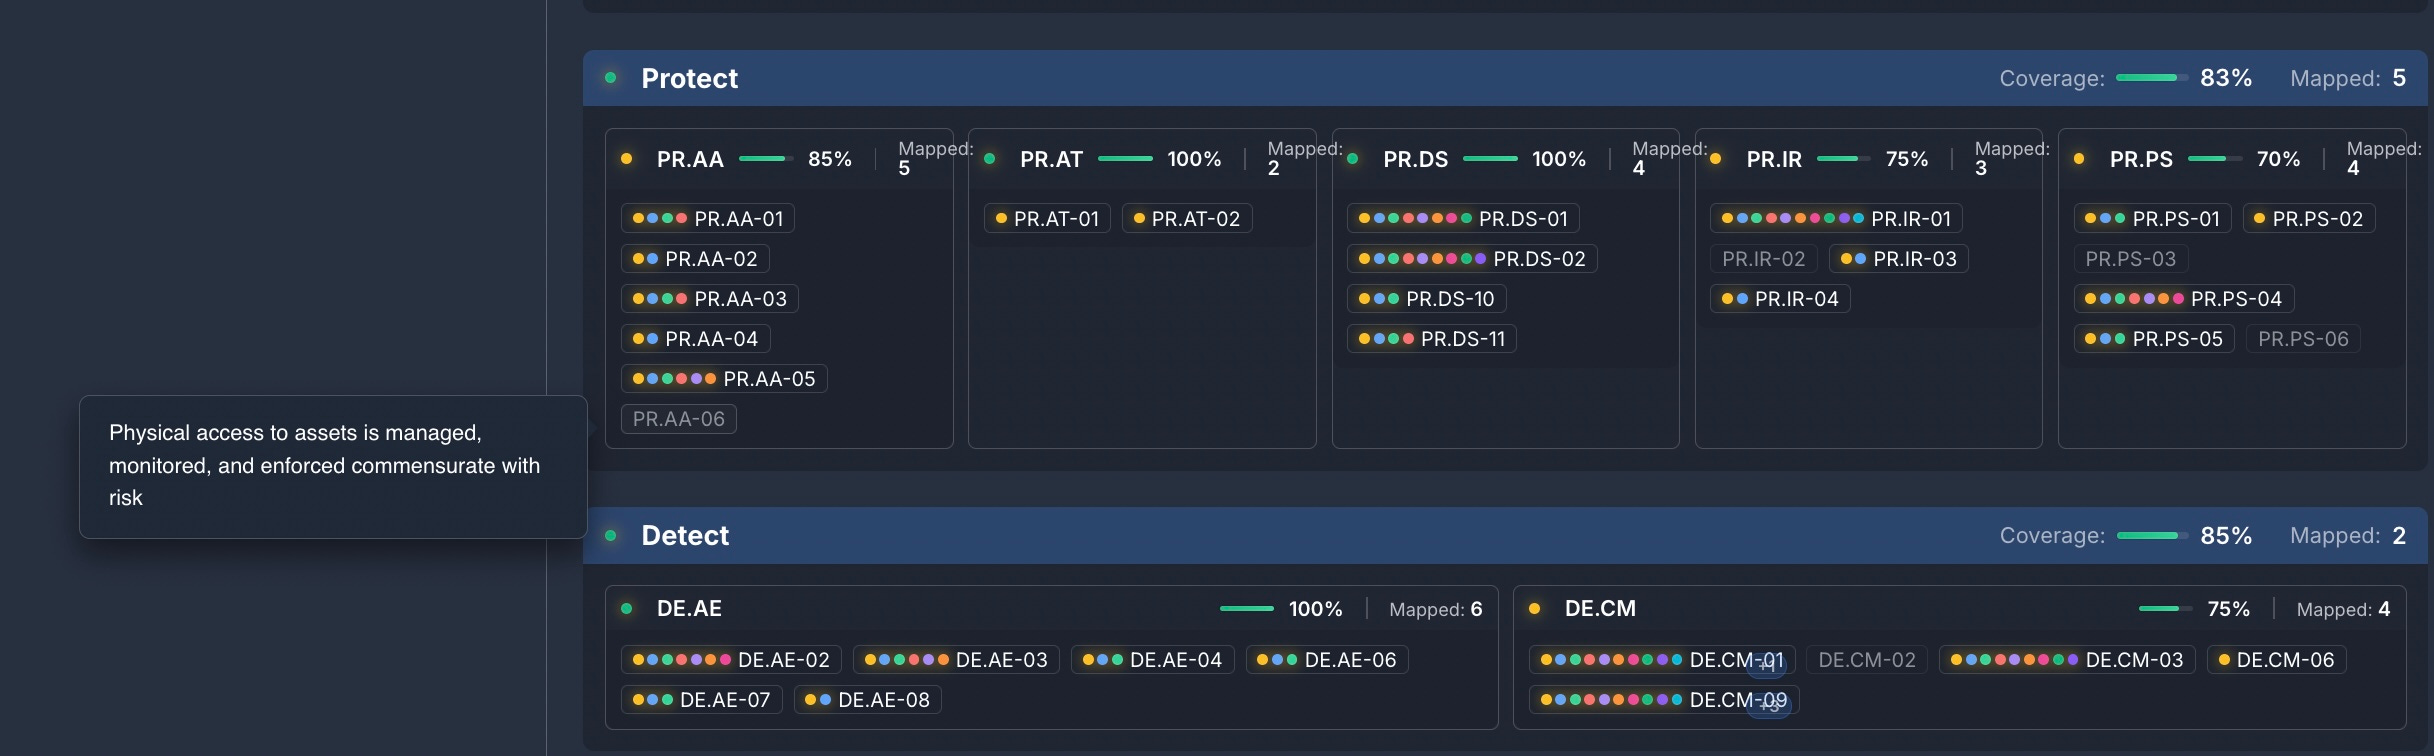
PR.AA-06, PR.IR-02, PR.PS-03, and DE-CM-02 all deal with physical environment security. It may well be that cabinet lock monitoring and CCTV cameras are in place but were not included in the Security Stack inventory, so not a problem. But that should be documented and included in any NIST coverage attestations.
Those who have tracked out progress since the initial launch of the Dashboard in March, 2022, will recognize this as the most impactful update yet to our platform. While the Dashboard is still extremely valuable for VCs and PE firms for investing decision support, vendors for OEM discovery and competitive intel, search firms for sourcing, and marketing services for client research, this new capability expands the value for security teams and consultants that serve them.