


More Data for the Analyst Dashboard
Double the data, quadruple the value.

When you are in the data business you develop a thirst for more data.
Yesterday one of the two dozen notebooks I fill with my ramblings fell open on a page describing the minimum data needed to launch the Analyst Dashboard.
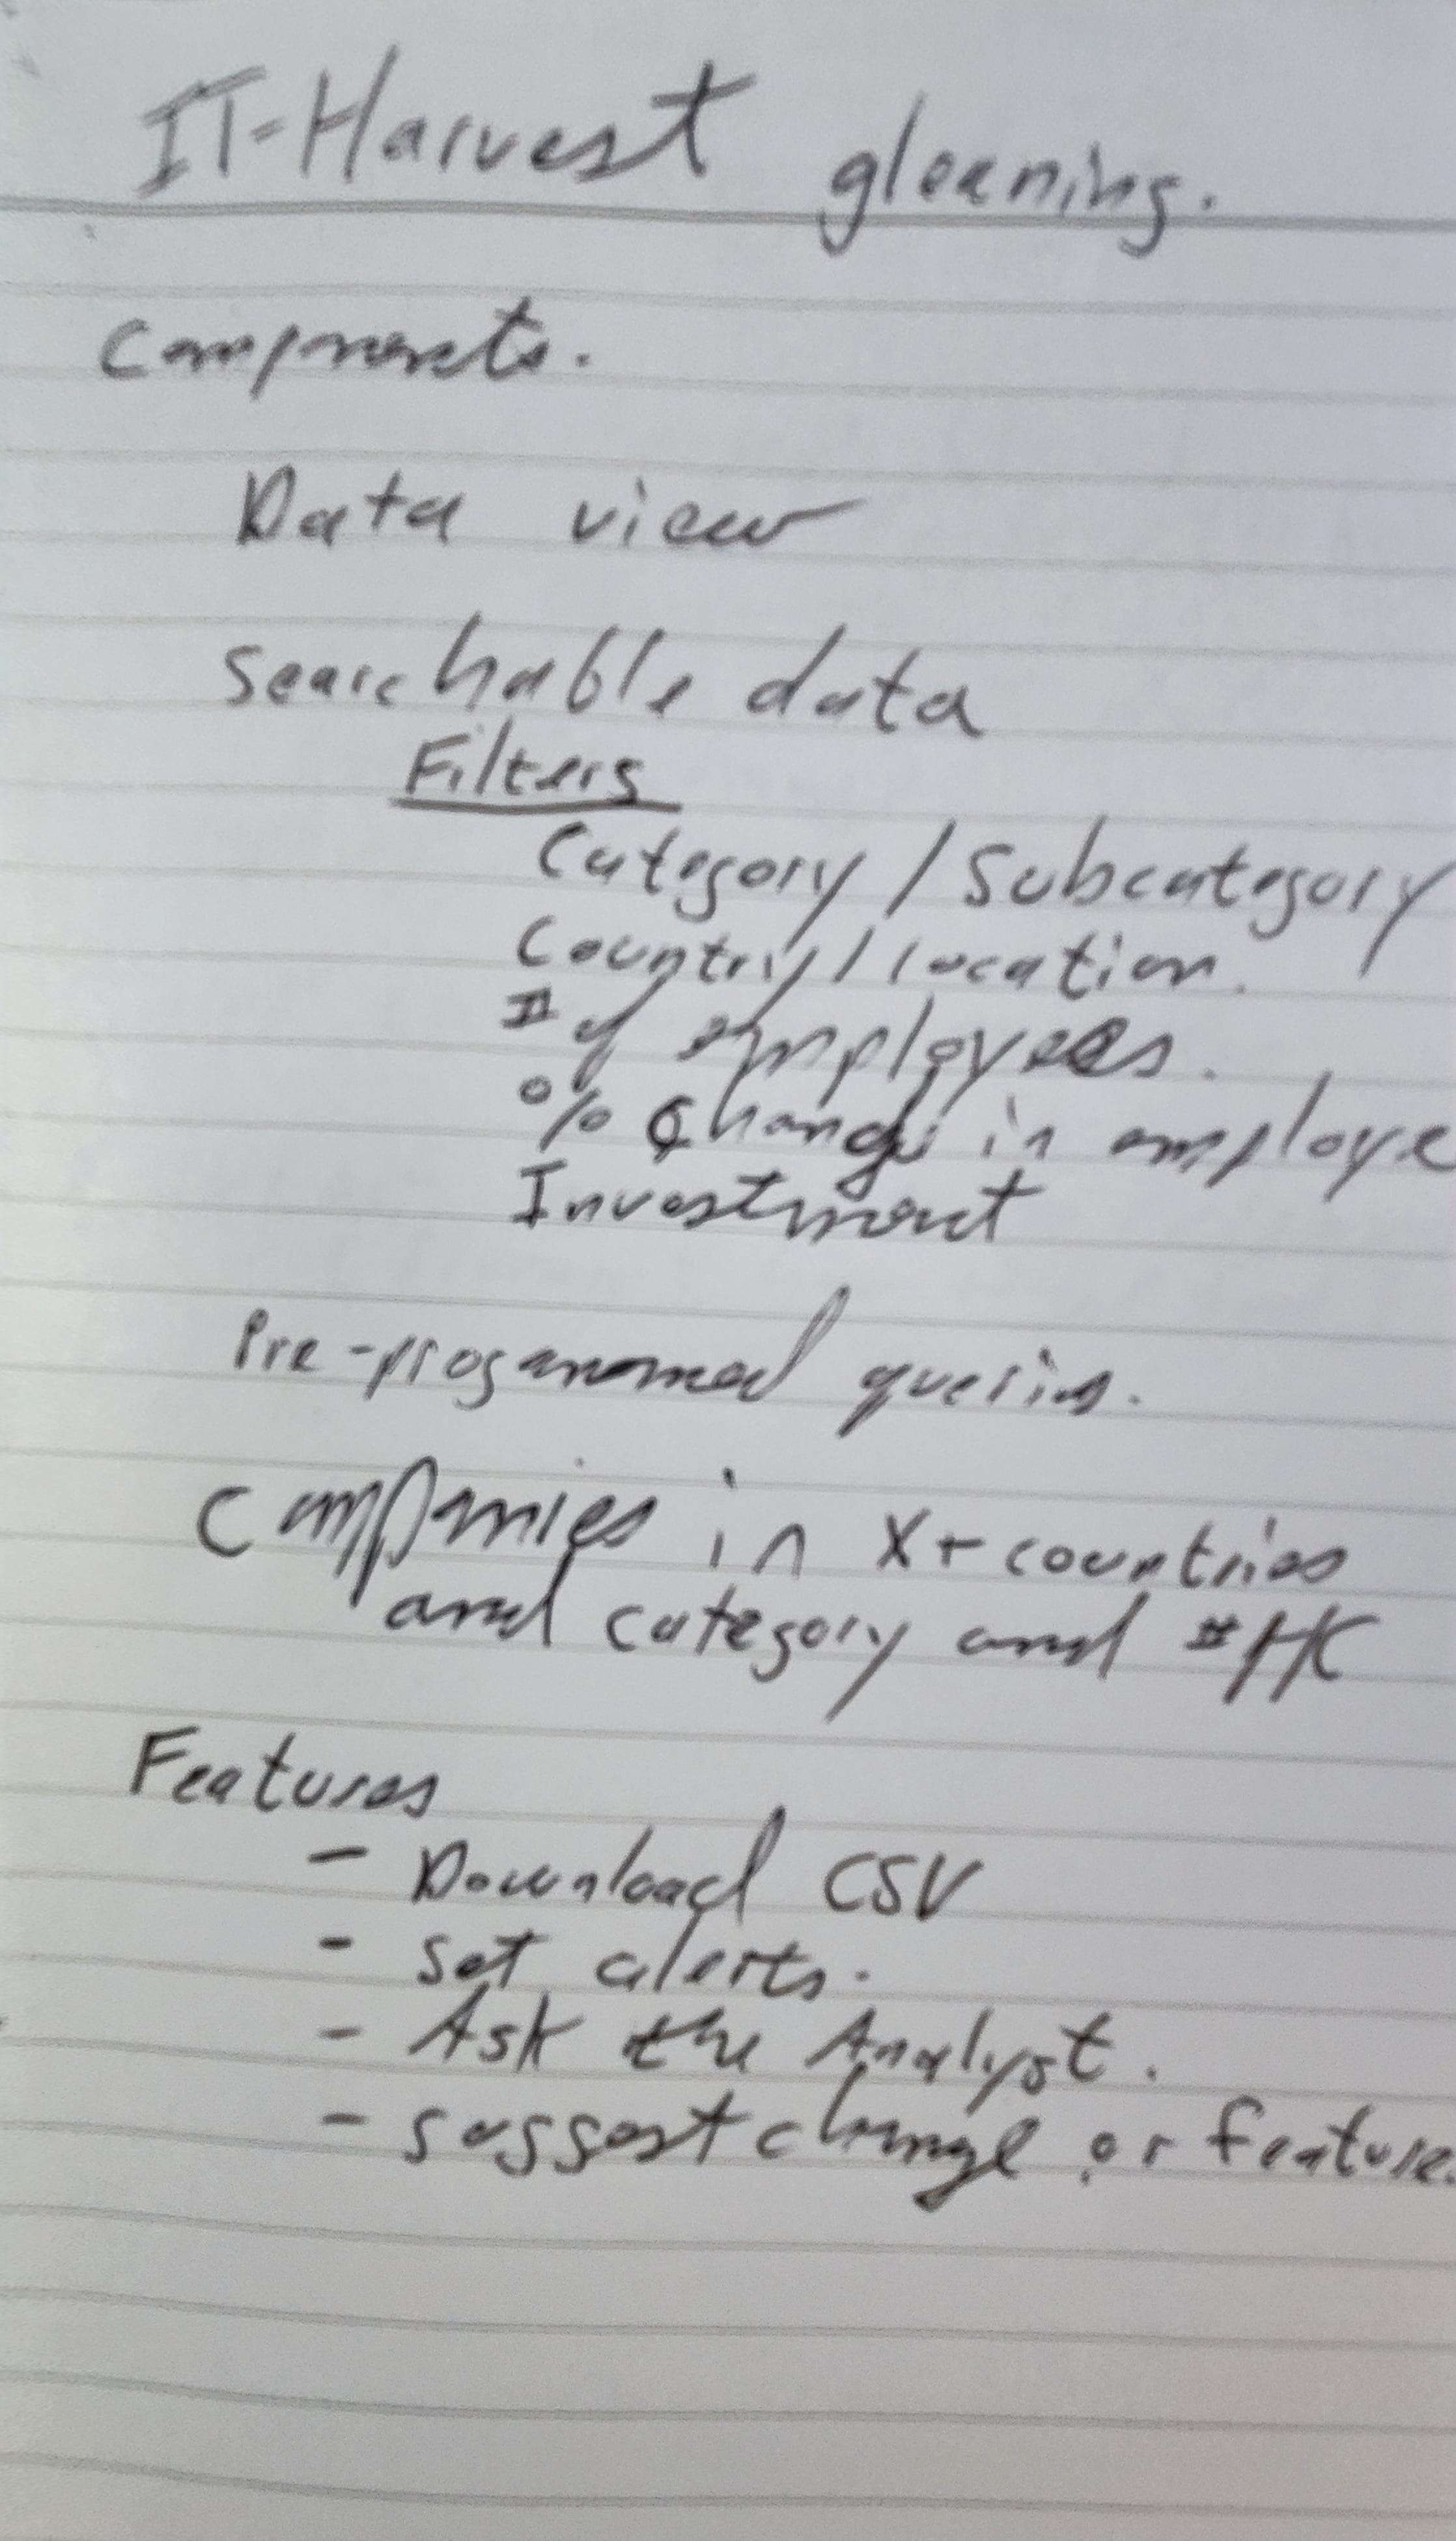
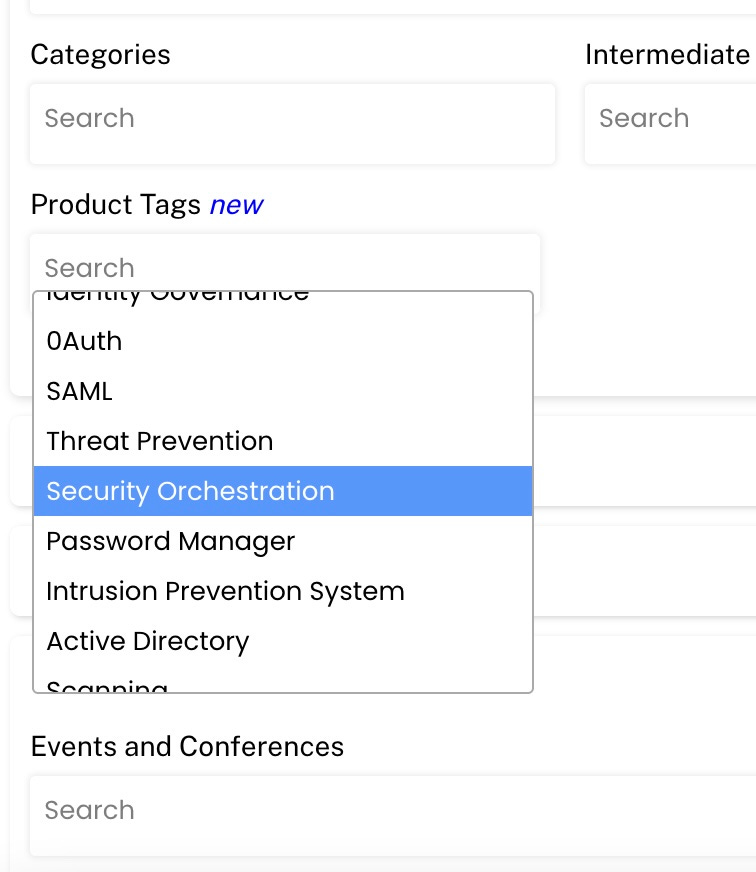
You can see that categories and subcategories were the top requirement. That one feature is still the most cited by our users as the most valuable. No other data source (Pitchbook, Crunchbase, Tracxn, Sourcescrub) categorizes vendors in a useful way. It’s no wonder because it takes an industry expert to do so. I calculate that I have invested 4,000 hours into the collection, categorization, and curation of vendor data. Only a firm like Forrester, Gartner, Omdia, or S&P Global Market Intelligence employs enough experts to categorize the 3,566 vendors we track today. They could, but their analysts are already working overtime with clients and on their own research. It would be very expensive to task them with going through the 50,000 companies on LinkedIn that are tagged as information security.
The other filterable data points we targeted were location, number of employees, percent change in number of employees, and investments. We had all these at launch on March 30, 2022.
Over the ensuing 17 months we have built the processes and hired the people to add:
-Conferences that vendors exhibit at
-Founding year
-Country breakdown of employees.
-Contacts of key executives. Many of our subscribers sell to cybersecurity vendors. This includes headhunters, content creators, or vendors looking for OEM partners. They like having contact details for founders, top sales person, top marketing person, and events person.
In January we ingested product data for the vendors. This is a major step for us because the longterm plan is to create a product selection platform that will go beyond the utility of a Magic Quadrant or a Wave. Instead of relying on an analyst to point out the top vendors in a category our subscribers can do their own research to create a complete list of ALL products. Then they can filter out vendors based on size, health metrics, etc. and create a shortlist of those they want to talk to.
You never know what data will be valuable. I know I want more. Every new data point leads to new insights. And insights are valuable to an industry analyst.
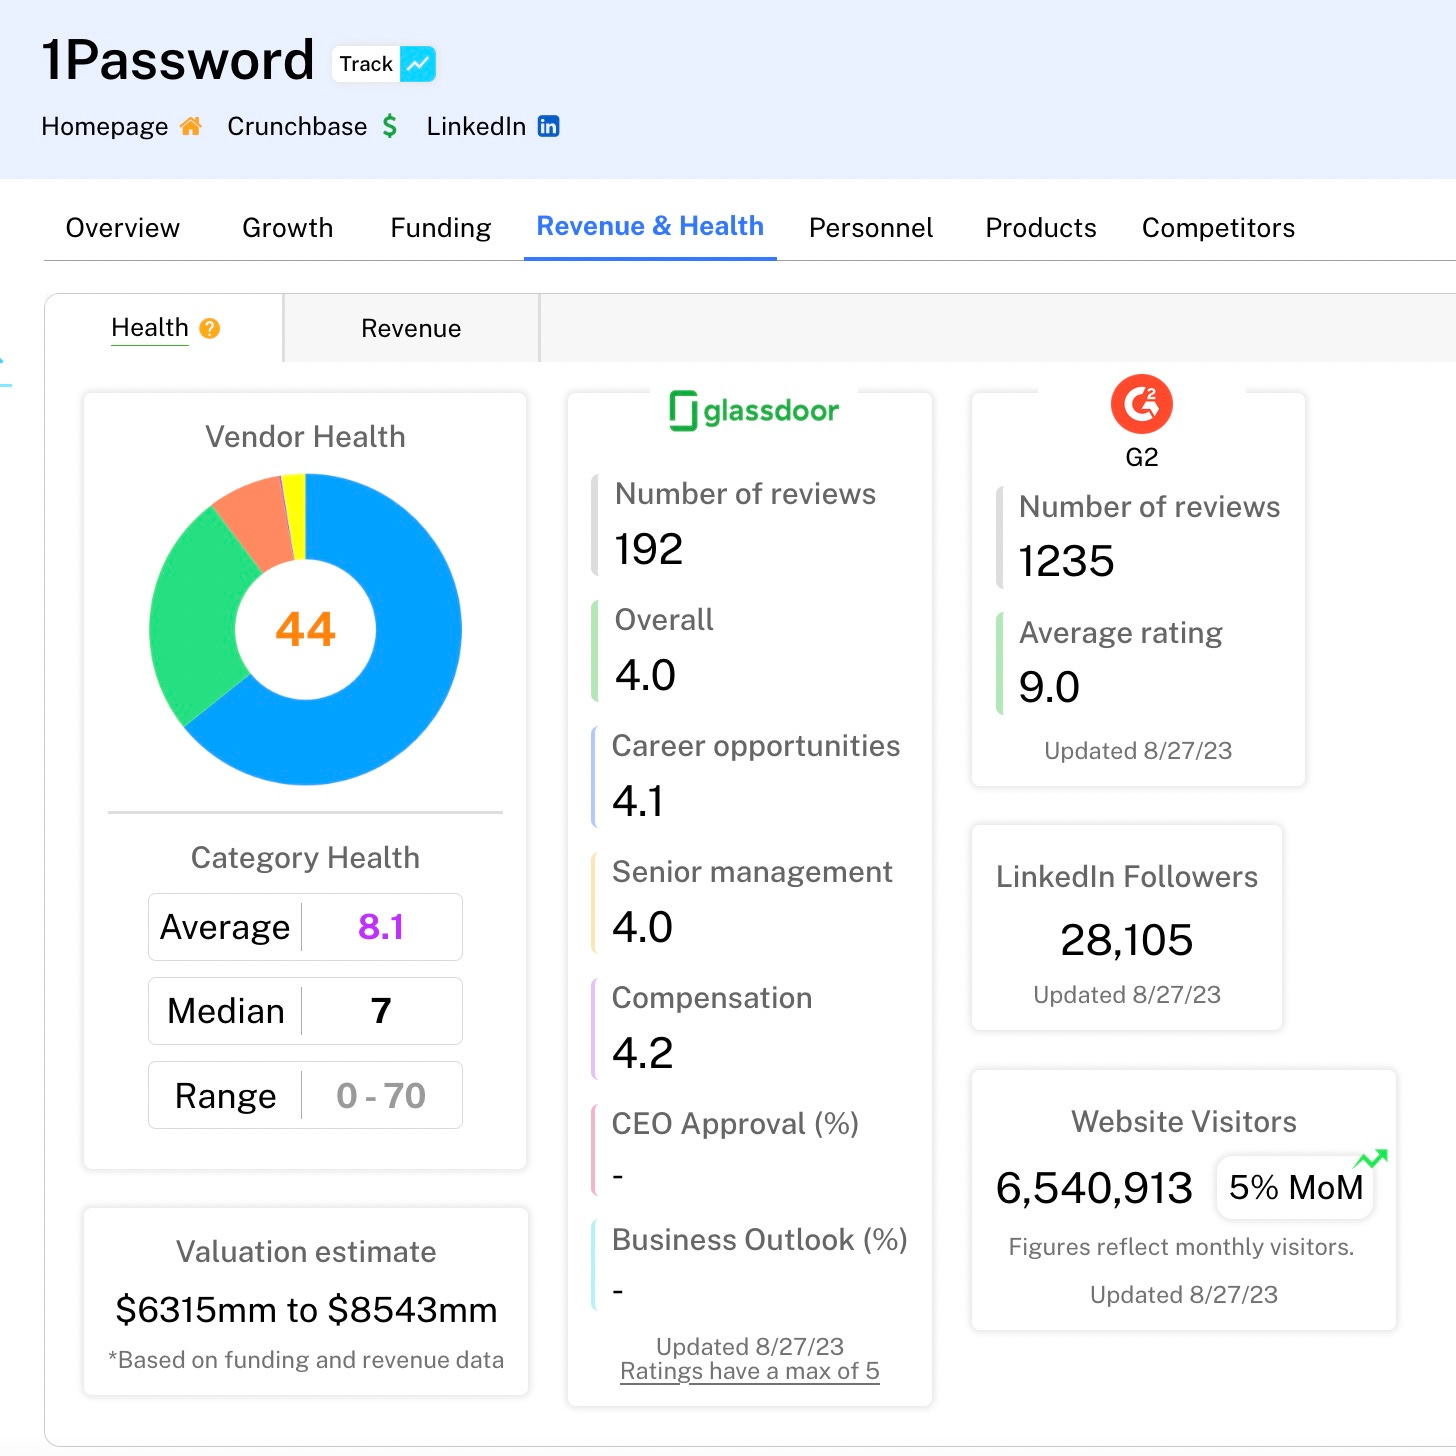
The following data points are now available in the Dashboard and are set to update every two weeks:
LinkedIn followers
LinkedIn follower growth rate
# of Glassdoor ratings
Glassdoor company rating
Glassdoor compensation rating
Glassdoor career opportunities rating
Glassdoor senior management rating
Glassdoor CEO approval percentage
Glassdoor business outlook percentage
Website visitors count
Website visitor growth
# of G2 ratings
Average G2 company rating
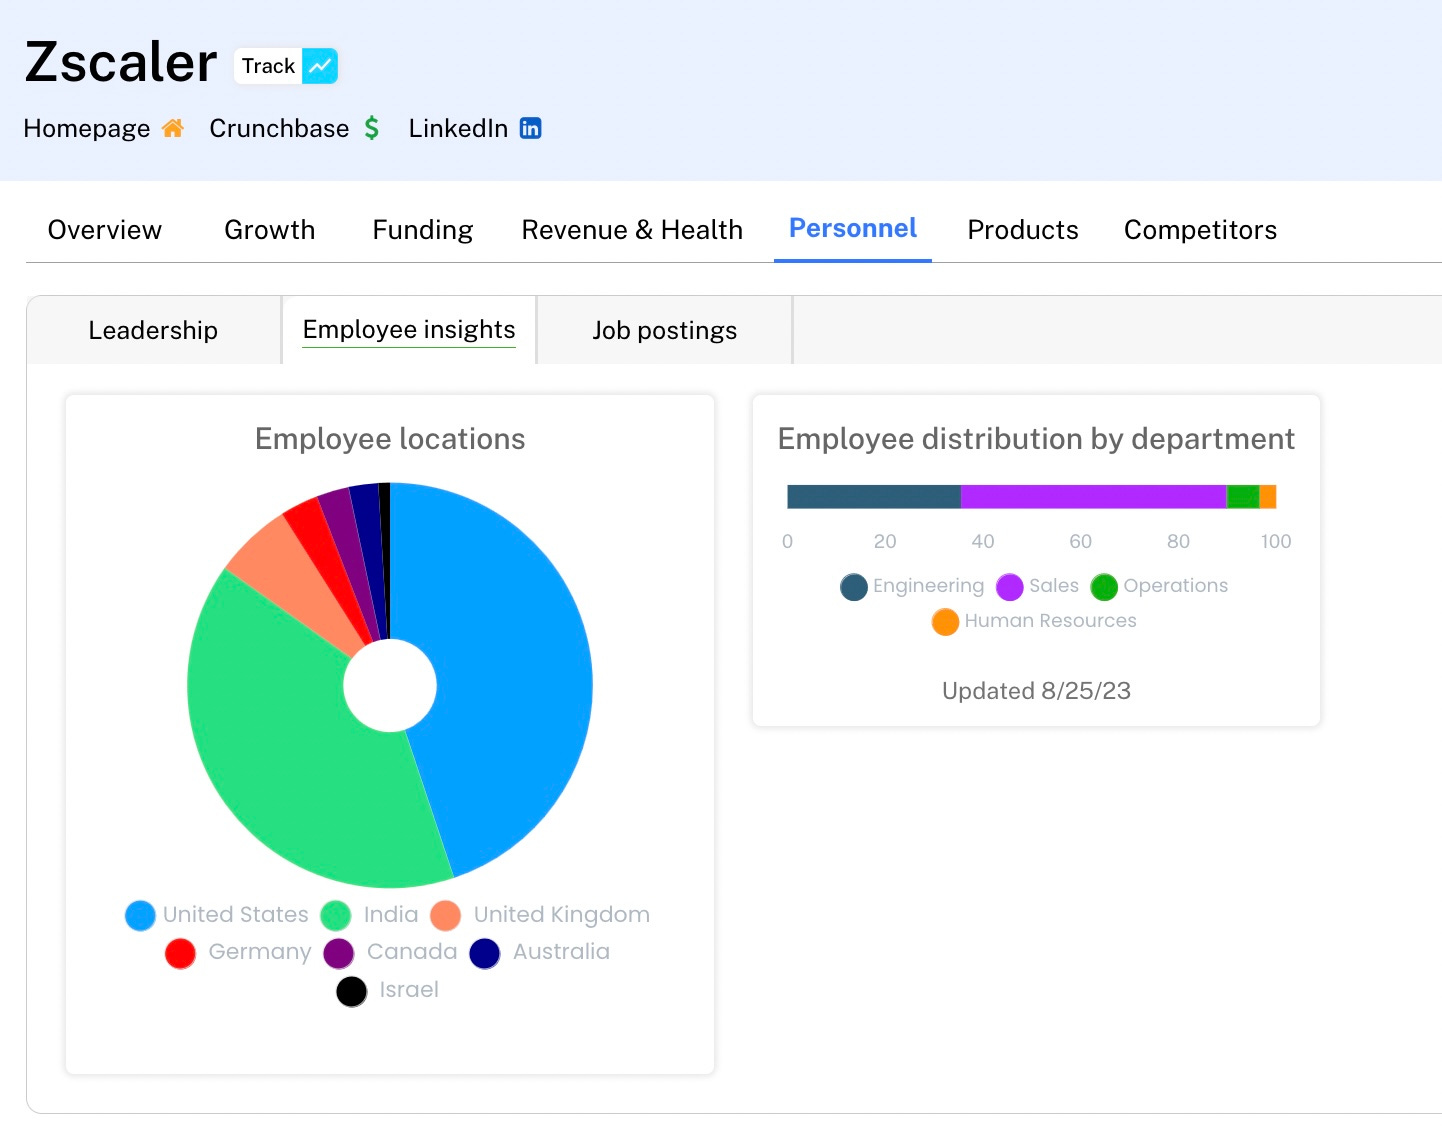
Number of employees by department (engineering, human resources, sales, and operations).
Here is how the data is presented.
And here is the data on employee by job function.
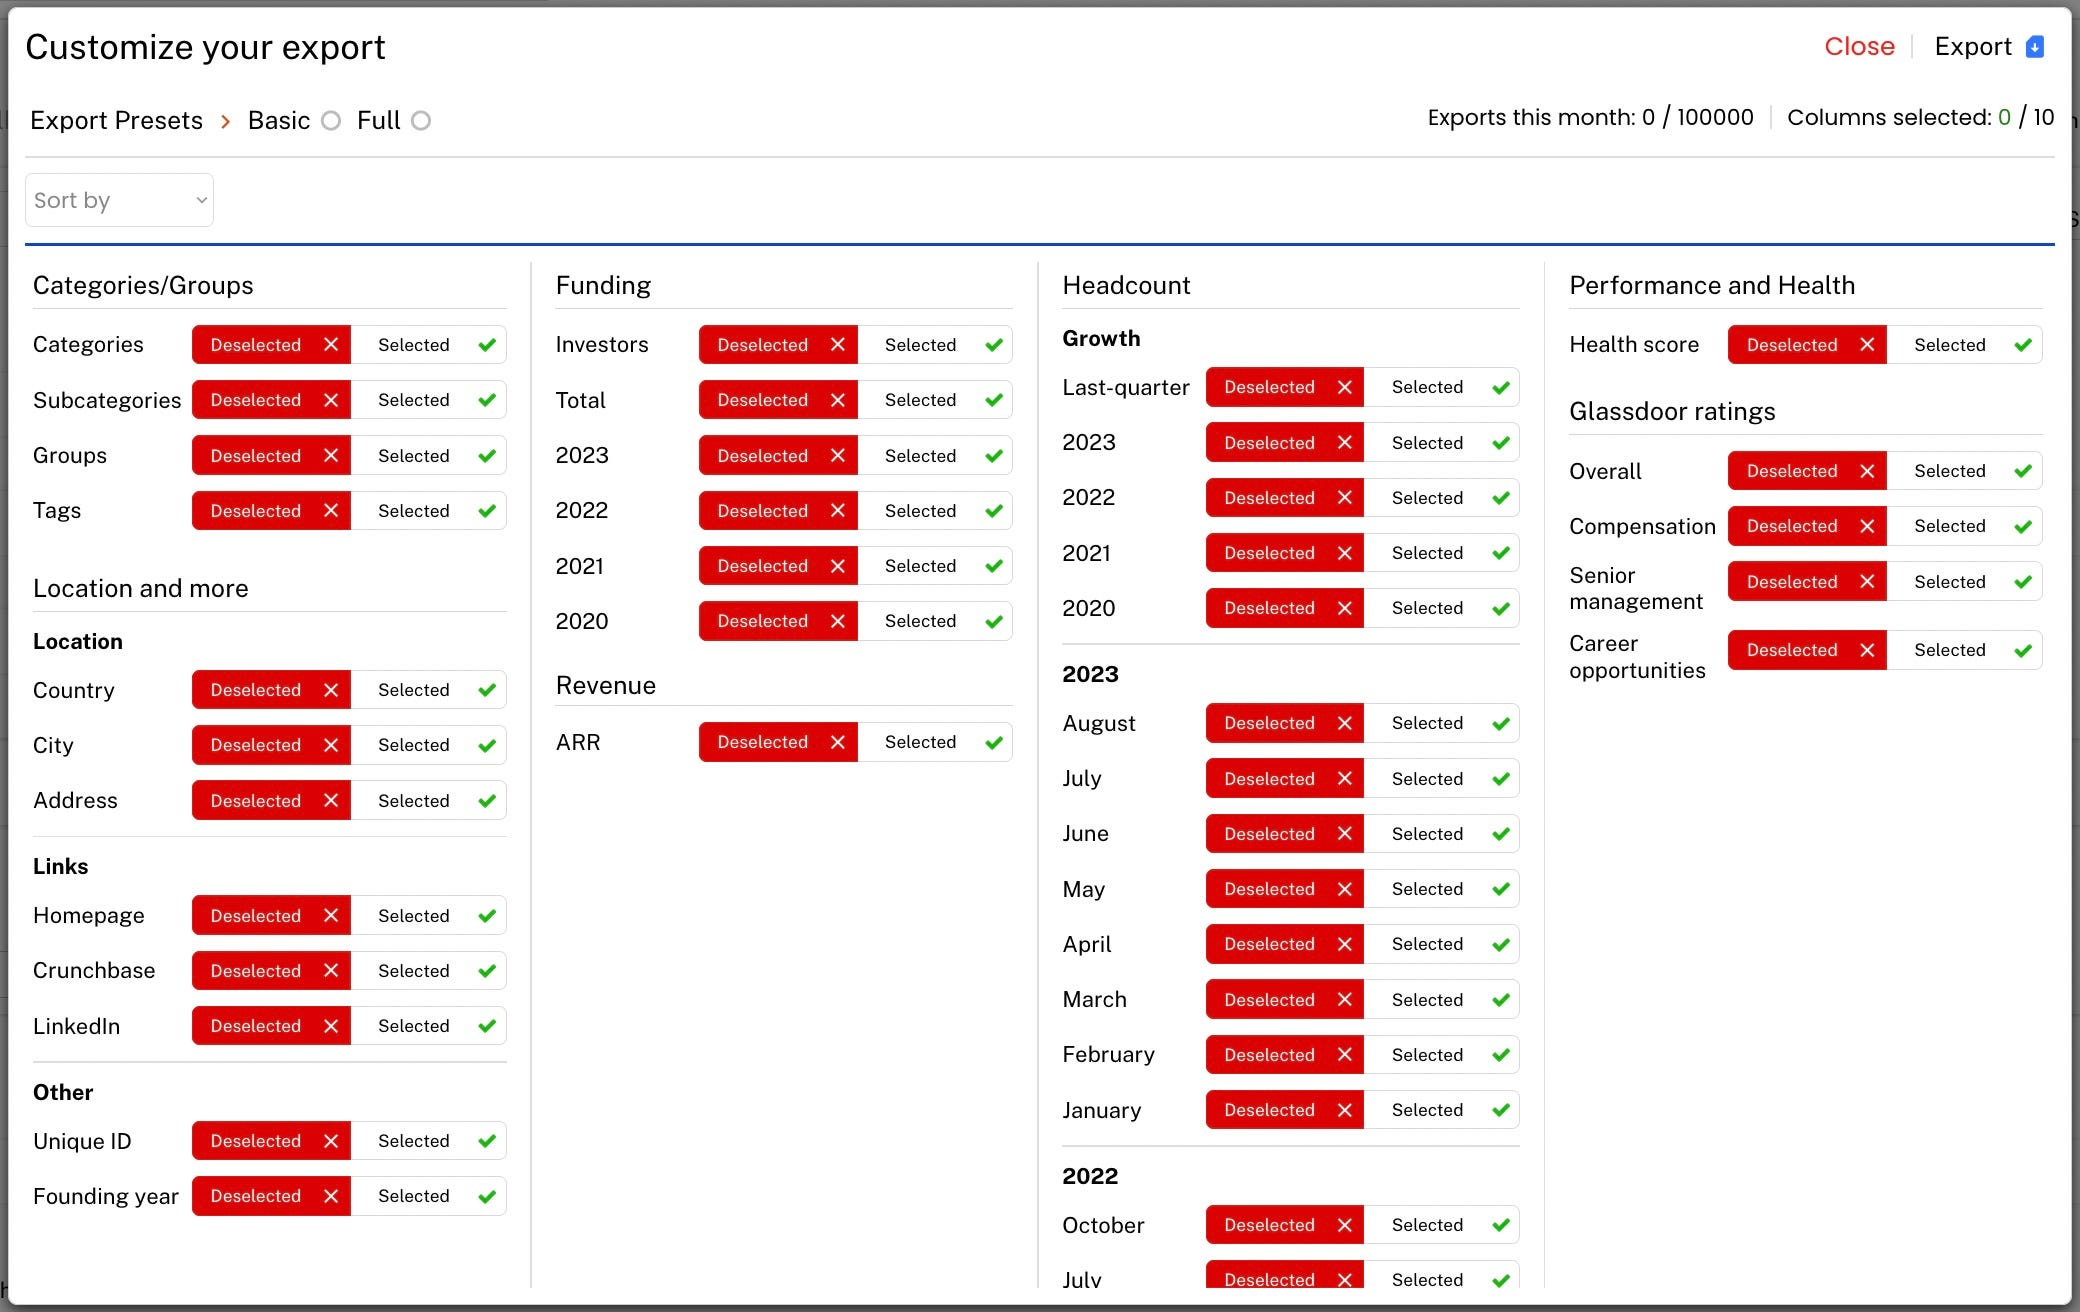
Subscribers can output CSV files of the results of their search. They can select the fields of interest which now includes that Glassdoor data.
This update also includes better documentation for API access to our data and improvements in speed across the board. As always, reach out to Dennis Portney (dennis@it-harvest.com) to schedule a demo and discuss your use case for the only platform for researching the cybersecurity industry.